- Inactive for 15 seconds ages out netflow
- Create and update netflow cache , then export them to collector
use UDP or SCTP
- Aggregate if configured
Pre processing
Packet sampling : statistical sampling
Filtering : status for specific network
To be exported :
15 seconds default inactivity
30 minutes export Active
Netcache is full it exports them to server
TCP RST & FIN Flag seen
(we don't export data to collector until flow expires)
Aggregation scheme (how you want to aggregate data)
Netflow versions for export
---------
5 include BGP AS information
7 only supported on catalyst
8 added aggregation
9 it is flexible and use templates
SCTP use TCP more relible

debug ip flow export
debug ip flow cache
ip flow-capture icmp
ip flow-capture mac-add
ip flow capture ttl
ip flow-capture vlan-id
ip flow-cache entries 1024
ip flow-cache timeout active 15
ip flow-cache timeout inactive 30 (seconds)
ip flow-export destination 12.0.0.2 port 9996
ip flow-export version 9
(enable netflow)
int fa0/0.23
ip flow in
ip flow eg
(if we ping R1 to R3) we get recorded ping on interface
show ip flow interface (show ip flow enabled interfaces)
show ip flow export template (show you timers)
(traffic sourced from router don't enter cache flow table)
* means egress traffic
Ip flow-top-talkers
top 10
sort-by packets
match protocol 1
show ip flow top-talkers
Aggregation configuration
----------------------
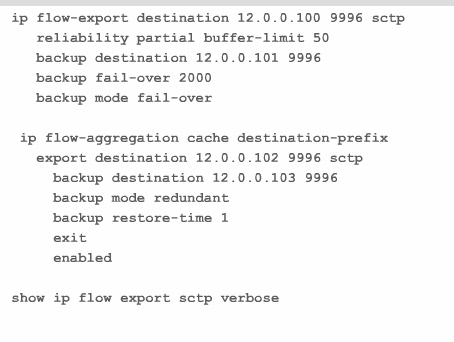
ip flow-aggregation cache destination-prefix
export destination 12.0.0.100 9996
export ver 9
cache entries 1024
show ip cache flow aggregation destination-prefi
Flow-sampler
====
flow-sampler-map MED-SAMP
mode random one-out-of 10
int fa0/0.12
flow-sampler MED-SAMP egress
*** Now if you apply it on interface this makes it when you do show ip cache-flow 10% less traffic
we can use policy-map
policy-map NETflowMAP
class class-default
netflow-sampler MED-SAMP
int fa0/0.12
service policyu-out
debug ip flow cache
ip flow-capture icmp
ip flow-capture mac-add
ip flow capture ttl
ip flow-capture vlan-id
ip flow-cache entries 1024
ip flow-cache timeout active 15
ip flow-cache timeout inactive 30 (seconds)
ip flow-export destination 12.0.0.2 port 9996
ip flow-export version 9
(enable netflow)
int fa0/0.23
ip flow in
ip flow eg
(if we ping R1 to R3) we get recorded ping on interface
show ip flow interface (show ip flow enabled interfaces)
show ip flow export template (show you timers)
(traffic sourced from router don't enter cache flow table)
* means egress traffic
Ip flow-top-talkers
top 10
sort-by packets
match protocol 1
show ip flow top-talkers
Aggregation configuration
----------------------
ip flow-aggregation cache destination-prefix
export destination 12.0.0.100 9996
export ver 9
cache entries 1024
show ip cache flow aggregation destination-prefi
Flow-sampler
====
flow-sampler-map MED-SAMP
mode random one-out-of 10
int fa0/0.12
flow-sampler MED-SAMP egress
*** Now if you apply it on interface this makes it when you do show ip cache-flow 10% less traffic
we can use policy-map
policy-map NETflowMAP
class class-default
netflow-sampler MED-SAMP
int fa0/0.12
service policyu-out
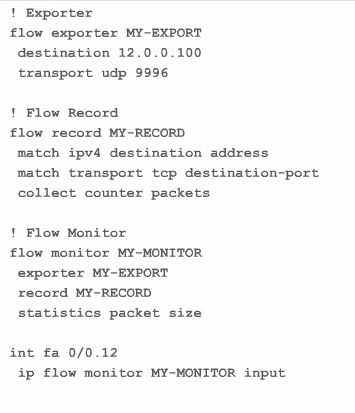
Verification for flow-monitor
===
show flow monitor MY-MONITOR
show run flow
show flow interface
show flow expo
===
show flow monitor MY-MONITOR
show run flow
show flow interface
show flow expo


 RSS Feed